It’s no secret that winning teams tend to score more Fantasy points. But just how much do the numbers skew toward the victor and should we consider this when selecting our side?
Let’s dive in and take a closer look at the numbers!
In this article, we will crunch the numbers on each game of the 2021 home and away season (excluding drawn matches) using the following win/loss margin subcategories:
- 0-30 points (pts)
- 31-49 pts
- 50+ pts – what many would consider to be a blowout
Further, we will look at the average fantasy points scored by teams based on these margin subcategories.
Let’s get stuck in!

Now I’m not big on pages and pages of analysis, so I will stick to the humble dot point. A couple of key takeaways from the table above:
- Teams toward the top of the ladder such as Port Adelaide, Brisbane Lions and Western Bulldogs were able to beat up on several of their opponents in some huge wins this season. Surprisingly, Essendon were tied for 3rd for 50+ point wins.
- Frustratingly for their supporters, Carlton and Collingwood were in so many of their matches. Much to everyone else’s delight, they couldn’t make a habit of winning their close games.
- Perhaps unsurprisingly, Gold Coast and North Melbourne topped the list for most 50+ point losses. North Melbourne’s start to the season was diabolical and Gold Coast continue to do Gold Coast things.
- The two eventual grand finalists (Melbourne and Western Bulldogs) never lost a home & away game by over 30 points. We all know how that ended up…
The big question is, do any of these numbers have any significance when it comes to Fantasy scoring? Read on to find out!
AFL Fantasy 2021 Archives
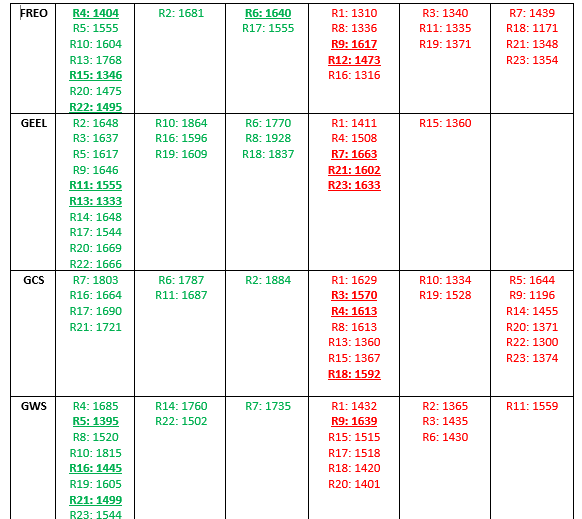
Now let’s have a look at each club’s fantasy output in every game of their respective home & away seasons. Keep in mind that drawn matches are not included. For example, Hawthorn had 2 draws and therefore only have 20 inputs.
In the table below, I have bolded and underlined matches where the winner of the game lost the Fantasy scoring and vice versa. For example, in round 13 the Crows defeated the Saints by 6 points. In this particular match, the Saints won the Fantasy contest (quite comfortably) 1656 to 1343. The Crows didn’t score until halfway through the second quarter (it was 29-0 at one point!). As a Saints supporter, for us to go on and lose was… well… very St Kilda.

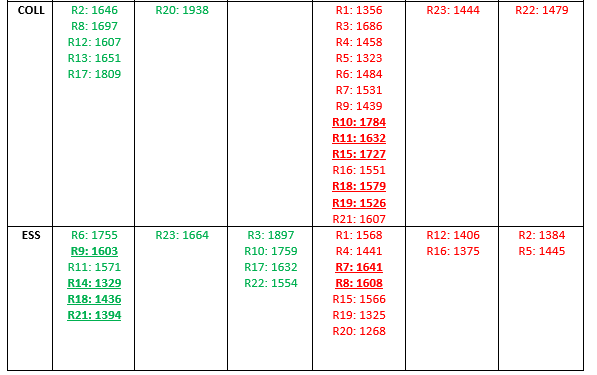


Key Takeaways
- Of the applicable 195 matches, 42 of these saw the winning side lose based on Fantasy scores (and vice versa). That’s about 21.5%.
- The range of Fantasy scoring this season was an abysmal 1097 posted West Coast in round 6 (a 97pt demolition from the Cats) to 1962 from Port Adelaide also in round 6 (a 54pt win over St Kilda).
- To put this into perspective, without including subs activated, West Coast players averaged 49.9 Fantasy points in their round 6 match while Port Adelaide players averaged a whopping 89.2! No one hit the ton for West Coast, while 8 Power players feasted on bulk points.
- Interestingly, round 15 saw the Western Bulldogs defeat West Coast in a blowout (55 points), yet West Coast won the day based on Fantasy output (1549 vs 1514).
- Similarly, Fremantle accounted for North Melbourne in round 6 by 51 points. North managed to win the Fantasy contest 1719 to 1640. This was the day when the man playing the most Fantasy friendly role I have ever seen, Jack Ziebell (ZBull) notched a disgusting 170! Incredible to watch and painful as a non-owner!
- These were the only two instances (out of 34 matches) where the side who won in a blowout, lost the fantasy scoring.
Now let’s get into those all-important averages, again categorised based on margin
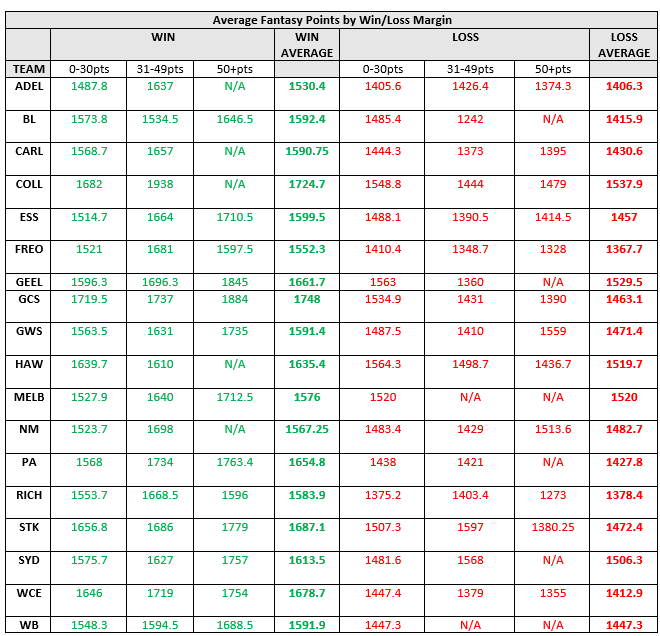
Key Takeaways
- Overall, the numbers suggest a trend toward winning and scoring greater fantasy points. However, as discovered, this was not the case in over 1 in 5 games played. In general, we see an average 100–300-point swing when a team wins versus when they lose.
- Collingwood and Gold Coast went huuuuge in games they actually won (noting this was only a total of 13)! They were the only teams to record an average >1700pts in wins.
- Pretty much every team enjoyed big Fantasy hauls when they won big (50+ points).
- Collingwood averaged the most of any side in losses, again indicating that they were in a lot of games of footy but couldn’t make a habit of winning. This may also coincide with their quantity of Fantasy guns (I’m thinking guys like Crispy, Reg, Adams when fit and De Goat later in the season).
- Keep in mind that in many scenarios, there is a small sample size. For example, GWS’ very respectable 1559 average in losses of 50+ points comes with a sample size of 1.
So what does this all mean when picking my AFL Fantasy side?
It’s really up to you what you make of these numbers, that’s the beauty of AFL Fantasy! Everyone does their own research and will have justification for their own selections. If you are tossing a coin between two players, it’s always worth looking into their upcoming draw and chances of said team cashing in on easy points. This is where resources such as Cal’s Scale of Hardness courtesy of DT Talk are invaluable in guiding your decisions.
One example I can provide from 2021 is Port Adelaide midfielder, Ollie Wines. Coming into the season, I believed Port Adelaide would enjoy some easy wins, which gave me greater confidence to select the big bull from the outset. What a selection it turned out to be! The eventual Brownlow medallist helping me on my way to 70th overall in Fantasy classic.
It’s important to remember that for uber premos like Touk and Steeley, these numbers don’t really matter, and I can’t see them causing any concern in the near future. So don’t let these numbers put you off these legends (it’d be more the price tag that is the issue!).
In saying this, without having done the analysis, there would be some players toward the premo price bracket that perform markedly better from a fantasy perspective when their side has a win. Someone like an Andrew Gaff from West Coast springs to mind. He tends to rely more on outside ball and possession footy around the ground. His comparatively poor season in 2021 was likely a product of the Eagles poor performances.

Where to now?
Extending on this, it would be interesting to look at the quantity of 100+ and 120+ scores or even taking a closer look at games decided by under a kick or two. Perhaps some food for thought for a future article!
So there you have it folks! Let me know what you think in the comments! How much do you consider selecting players from winning teams, and better still, those capable of a blowout or with a favourable fixture?
Quick shoutout to dtlive.com.au and www.fanfooty.com.au for providing the goods for every game of the 2021 home & away season! Also big thanks to Microsoft Word for making the tables happen… Feel free to reach out if you want any further information.
Cheers and happy selecting!
Fantasy Fanatic #70

Awesome analysis here. Laffy’s legend (FKA Jonah’s Jets) are on the re-build with some a-grade research behind them.
LikeLiked by 1 person
You love to see it mate! Hopefully the relocation up to Cairns (and new team name) will do wonders for Laffy and his legends!
LikeLike
Pingback: The Weekend That Was: Round 2 | Fantasy Fanatic